gartop
System Monitor
A modular system monitor daemon and interactive GUI for the gardesk environment. Real-time monitoring of CPU, memory, network, disk I/O, temperature, GPU, and processes with time-series graphs and an interactive process list.
Features
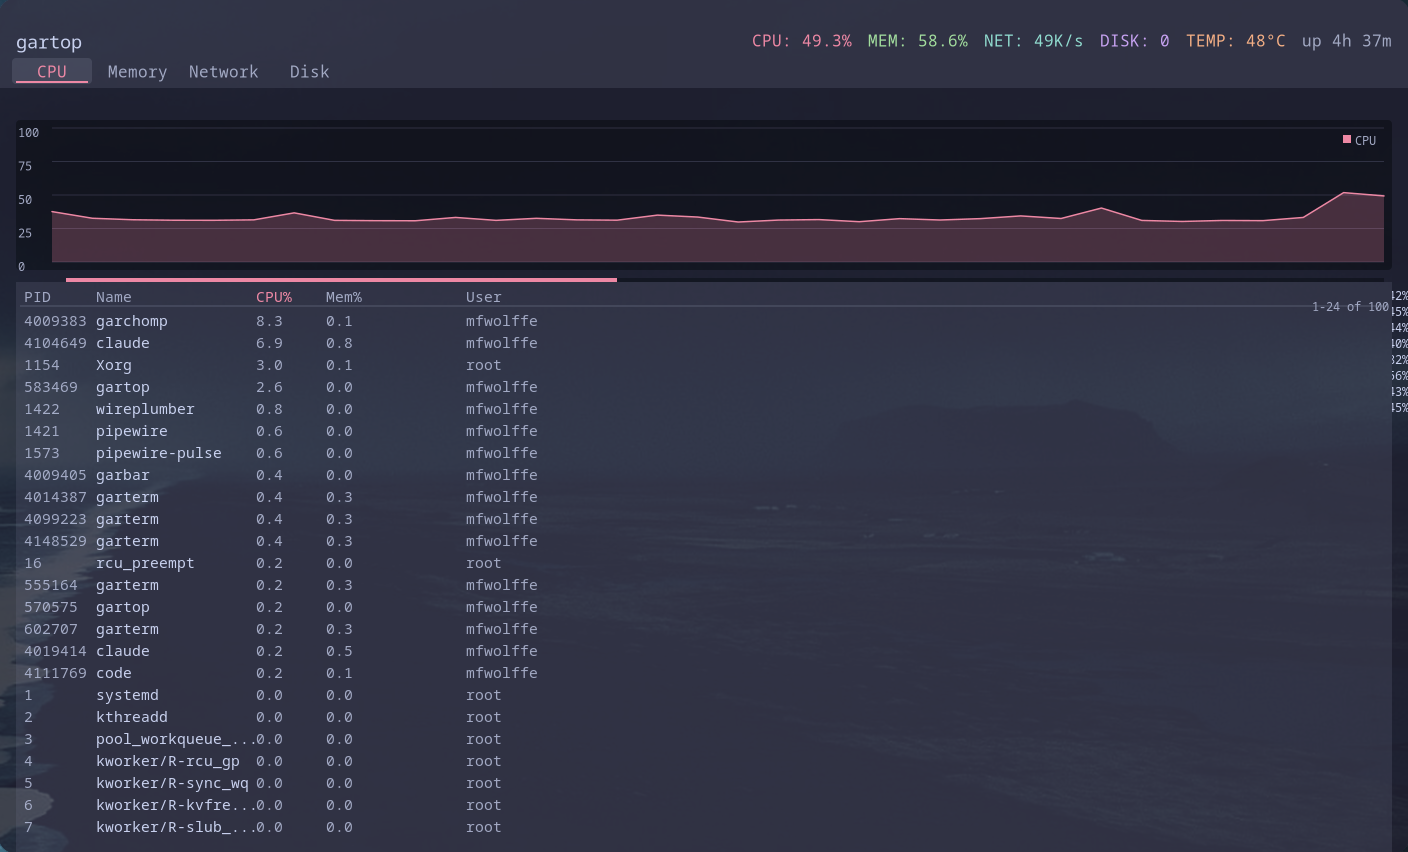
- Real-time CPU monitoring (overall and per-core)
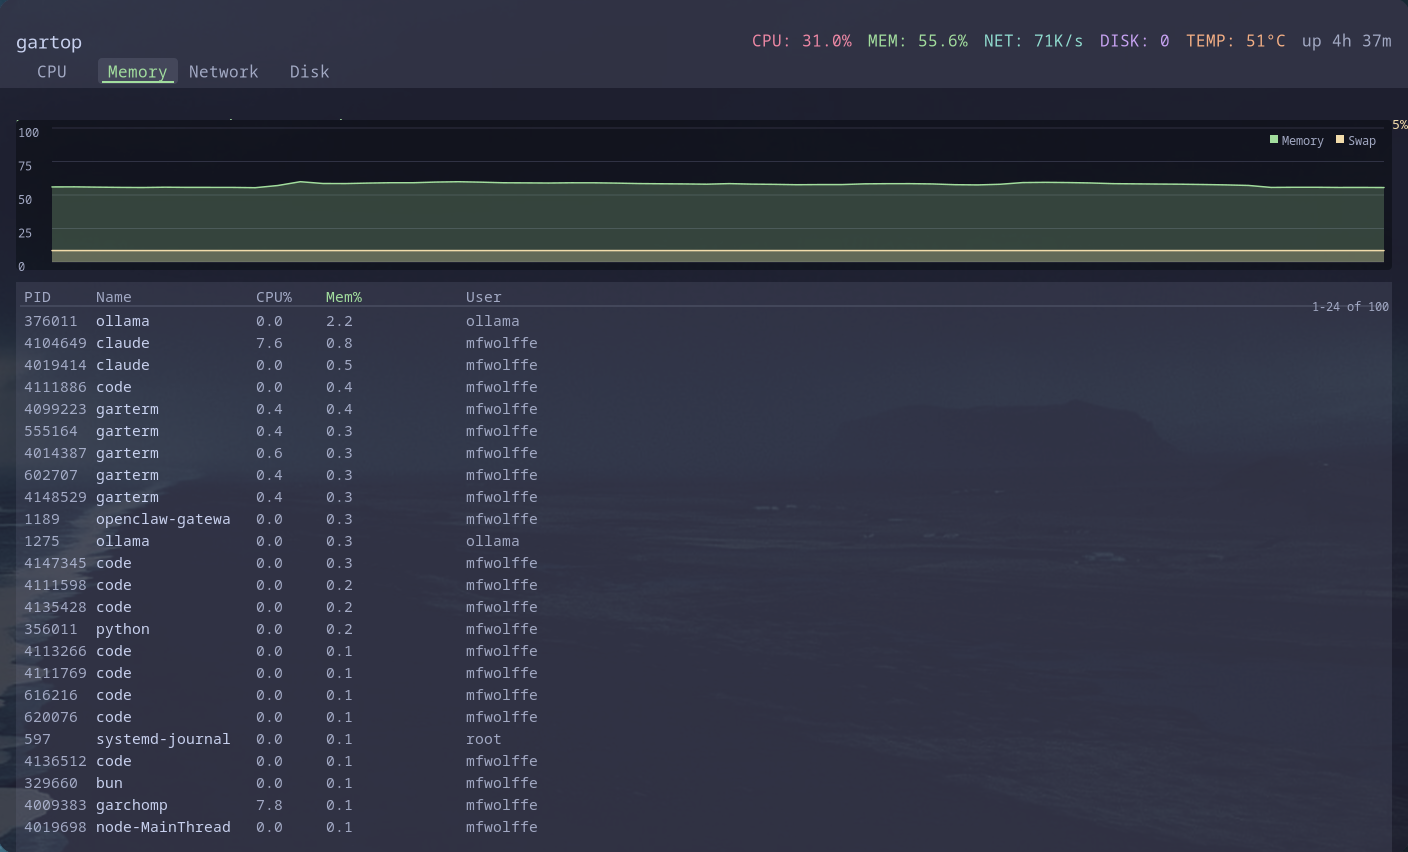
- Memory and swap usage tracking
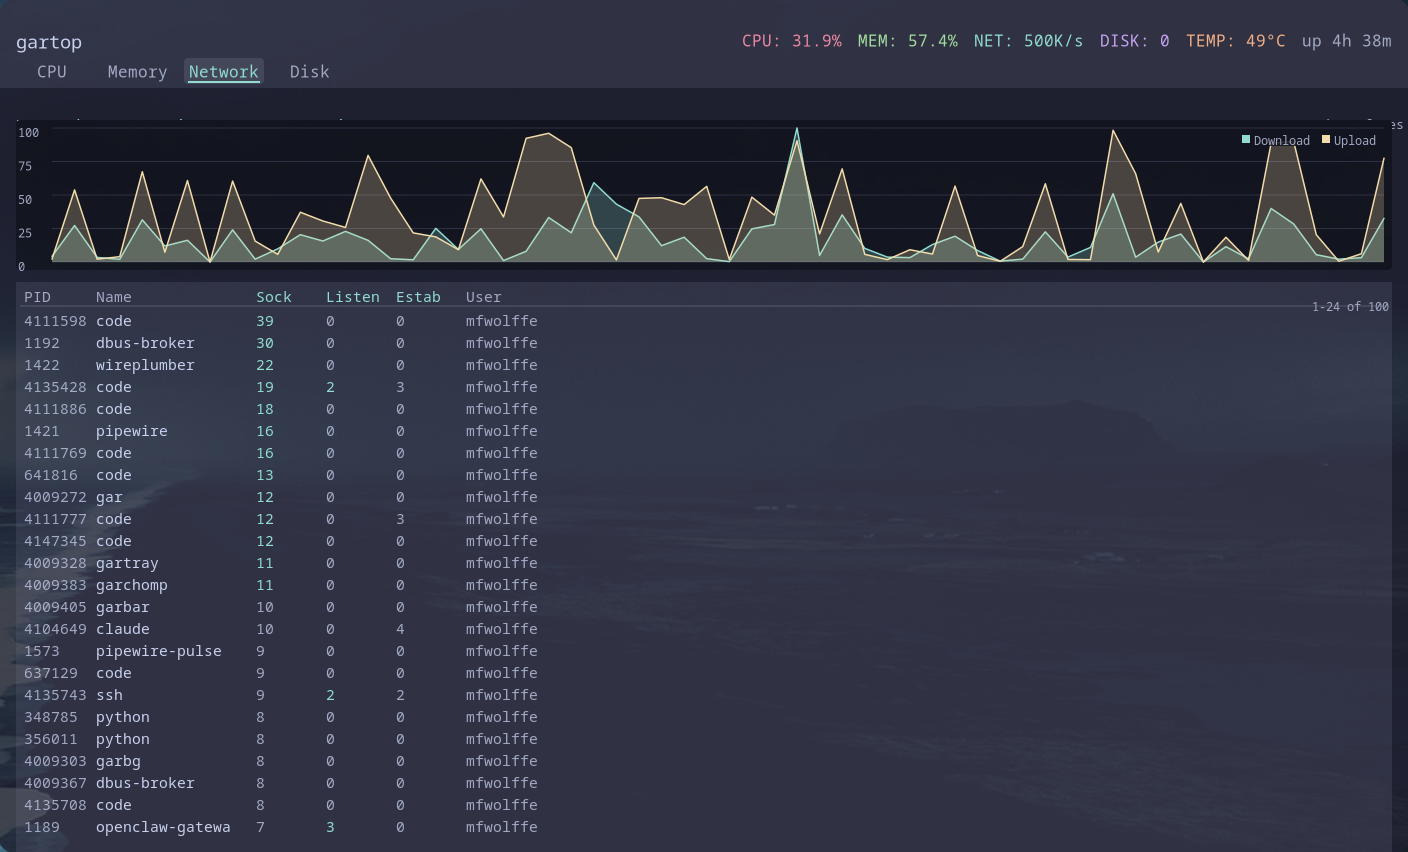
- Network interface statistics and rates
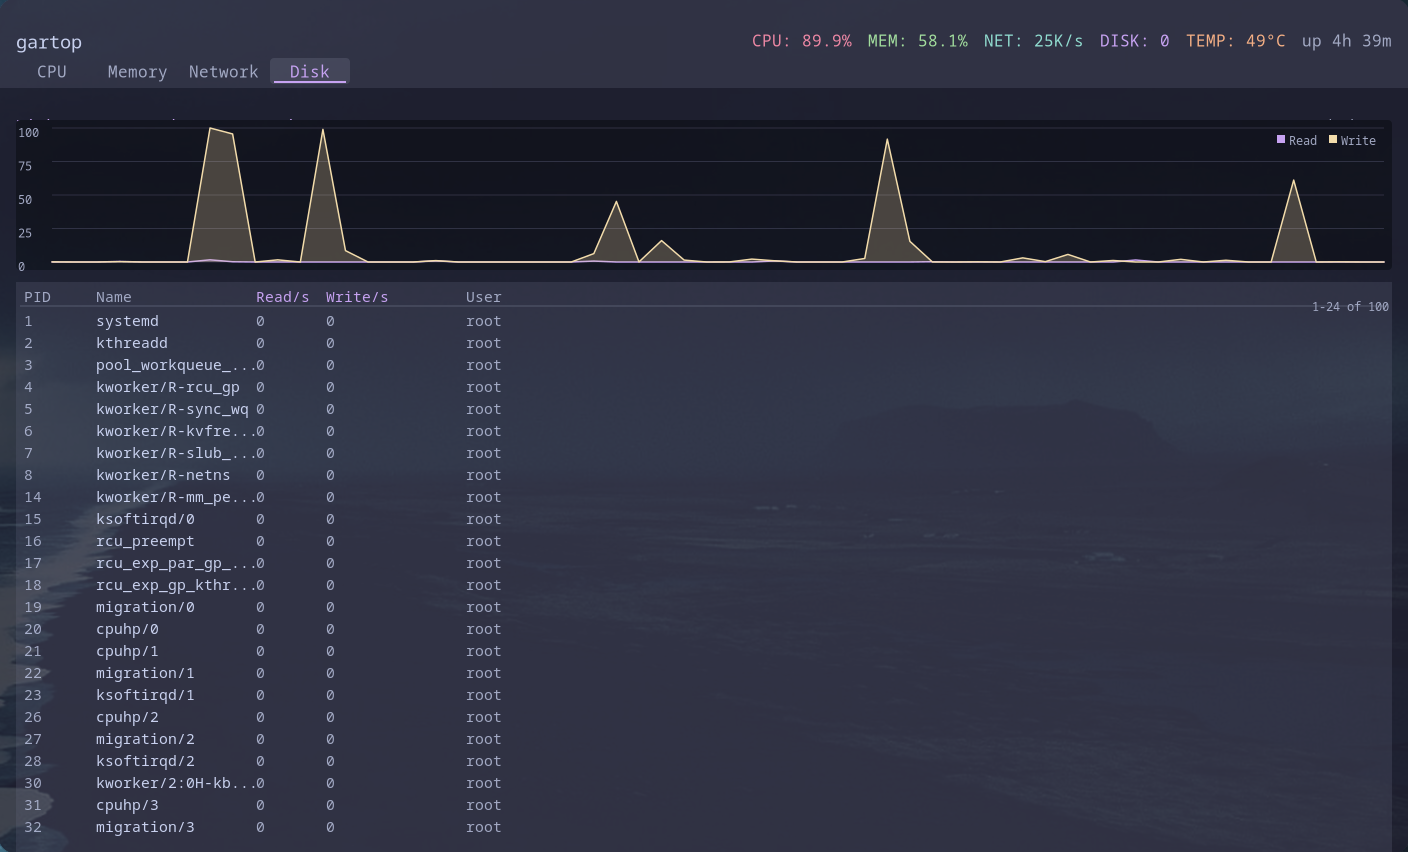
- Disk I/O monitoring per device
- Temperature sensors via hwmon
- GPU utilization and VRAM usage
- Interactive process list with tree view
- Process detail overlay with per-process sparklines
- Container detection (Docker, Podman, Kubernetes, LXC)
- Per-process network socket tracking via netlink
- Time-series graphs with Cairo rendering
- Catppuccin Mocha color theme with per-metric colors
- Background daemon with ring buffer history
- Type-to-jump fuzzy process navigation
- CLI control via gartopctl
- Configurable collection intervals
- systemd user service integration
Quick Start
What is gartop?
gartop is a system monitor consisting of a background daemon that collects metrics and an interactive GUI for visualization. It monitors CPU, memory, network, disk, temperature, GPU, and running processes.
The daemon maintains a ring buffer history of metrics that can be queried via gartopctl or displayed in real-time graphs.
Installation
Install gartop using the unified installer or build from source:
Running gartop
gartop can run as a standalone GUI or as a daemon with separate visualization. Running with no subcommand launches the GUI.
GUI Mode (Default)
Daemon Mode
Querying with gartopctl
systemd Integration
Run gartop as a systemd user service for automatic startup: